
Quarter 1 Market Update
George Santayana, The Life of Reason
Since the investment markets are nothing if not recurrent, this quote seems appropriate as we try to understand market cyclicality, avoid the temptation to think “this time is different” and keep a long-term perspective. A quick review of financial markets in 2023 should help orient our bearings relative to the end of the first quarter and our near-term outlook.
As much as 2022’s stock and bond losses were due to the speed and magnitude of rising interest rates, 2023’s bounce-back gains were a mean reversion, especially in stocks. Enthusiastic consumer spending, resilient corporate profits and excitement around the advancements of artificial intelligence (AI) fueled the market’s recovery. Equity market performance was not broad-based, however, with the largest US mega-tech names (like the “Magnificent Seven”) accounting for the vast majority of gains. Growth stocks outperformed their value counterparts by a wide 3.5-to-1 margin last year, even though a three-year annualized lookback has them relatively even.
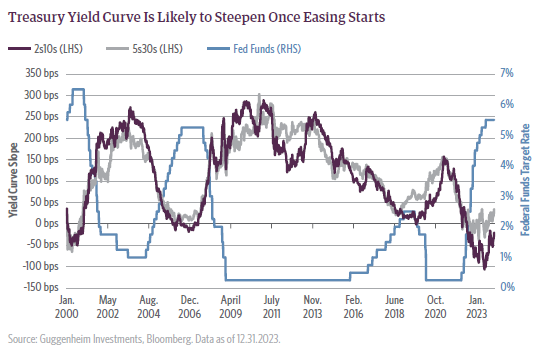
Volatility was the defining feature of 2023’s bond market, with the Federal Reserve hiking the fed funds rate by 25 basis points (bps) four times between February and July. Then, in anticipation of 2024 Fed rate cuts, the bond market rallied in the last two months of the year as the 10-year Treasury yield dropped over 70 bps. The yield curve remained inverted, with the 2-year Treasury enjoying a 0.35% (35bps) yield premium over the 10-year. Even with the move lower, fixed income investors enjoyed much better income and total return opportunities than existed a year earlier.
The macroeconomic backdrop markets operated in as 2023 rolled into 2024 was uncertain. With interest rates and inflation coming down off their highs, opinions on whether the Fed would pilot either a hard or soft landing wavered. A hard landing would mean a sharp economic slowdown (i.e. recession), with potential negative outcomes like increased unemployment, weakened consumer confidence and substantial stock market declines. A soft landing implied a controlled economic slowdown with growth slowing as it approached but avoided a recession. A soft landing is clearly preferable and key metrics suggest it’s feasible, but the irony is confirmation you’ve been in a recession doesn’t come until after it’s happened.
A review of several vital economic areas is meaningful:
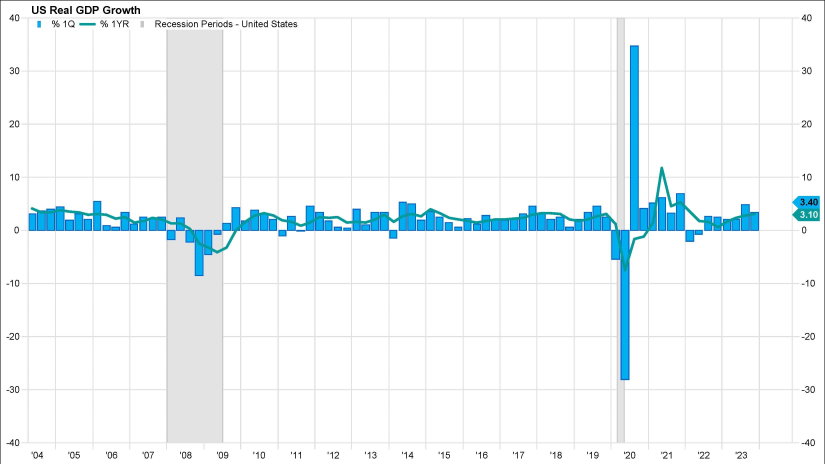
- US Gross Domestic Product (GDP) – the total real GDP growth for 2023 was 2.5%, with strong advances in the third and fourth quarters. Year-over-year growth relative to 2022 saw a 32% positive rate of change. Current estimates for 2024 real GDP growth sit at 2.0% (FactSet), which, if it holds, indicates a US economy with slowing growth, but growth nonetheless.
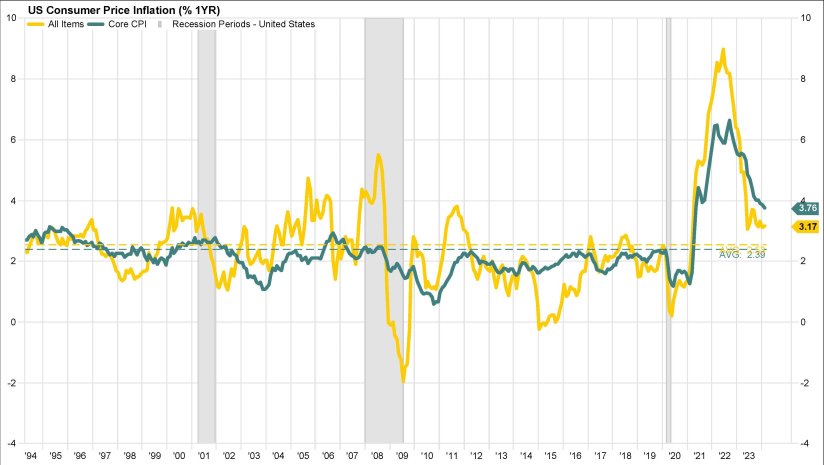
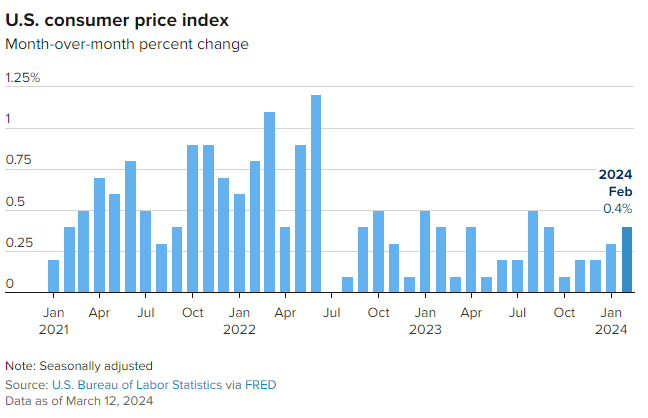
- The Rate of Inflation – inflation is decreasing and well off its June 2022 high of 9.1%. Through February, the 12-month run rate for CPI was 3.2%, trending lower but still well above historical averages and the Fed’s targeted goal of 2.0%. While the food category saw a 0.0% growth rate in February, gasoline prices spiked 3.8% in the month. Suffice it to say inflation remains sticky and is likely to descend stubbornly.
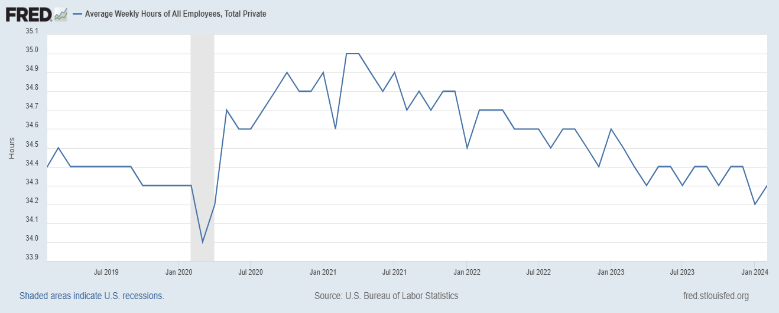
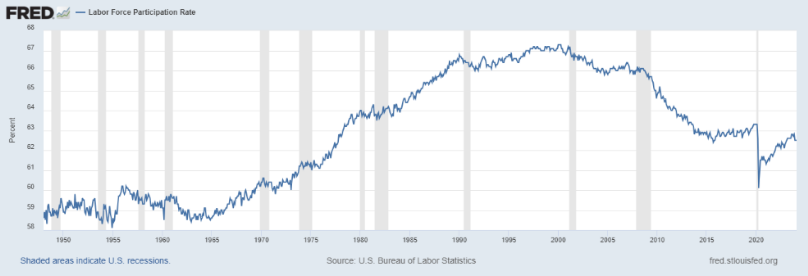
- Unemployment – the current unemployment rate at the end of February was at 3.9%, well off the peak pandemic rate of 14.8% and above the January 2023 low of 3.4%. Even at a low level of unemployment, the average number of hours worked by employees continues to fall to the current level of 34.3 hrs./wk. (St. Louis Fed), exactly where the data was in December 2019 prior to the pandemic. An area of concern is the Labor Force Participation rate, a demographic of the working-age population. When you combine workers 55 years of age and older who did not return to the workforce post-pandemic with a workforce averaging less than 40 hr./wk., you have a consumer base with less purchasing power.
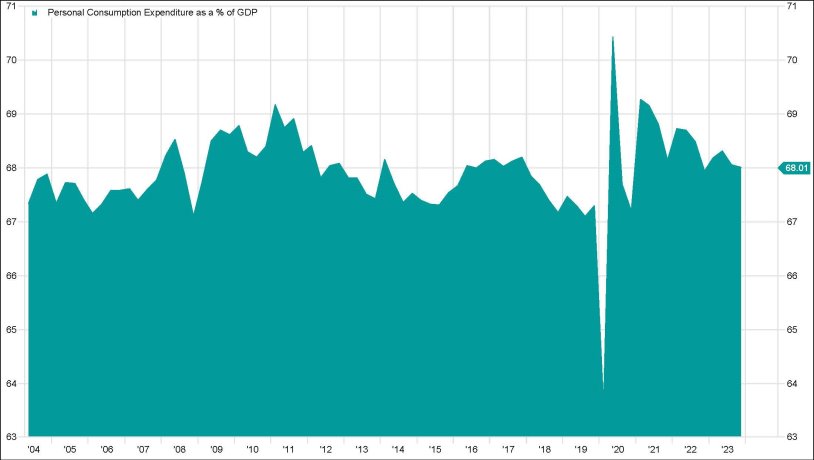
- The Consumer – as measured by the Personal Consumption Expenditures (PCE) rate, a measure of consumer spending on goods and services among households in the US, the consumer has historically accounted for two-thirds of US GDP. Pandemic lockdowns saw the PCE rocket to over 70% of GDP, supply chain disruptions then quieted the rate as goods became scarce, and it currently sits at 68.03%. With the rate of Retail Sales ex-Autos slowing below its 20-year average, the consumer is still spending, but at a slower pace.
- Corporate Earnings and Revenues – for the full year 2023, the S&P 500 Index saw its overall earnings per share decline by 1.2% compared to 2022, and below its 10- and 20-year averages. The Index’s 2023 revenue per share growth was 5.6%, a drop-off from the previous two years but in line with 10- and 20-year averages. Company managements appear to be dealing with slowing revenue growth by managing costs at every margin ratio (Gross, EBITDA, Pretax, Net, FCF, et al.). From a valuation standpoint, the S&P 500 Index ended 2023 trading 8% higher than its 10-year average P/E of 22.0 and 24% higher than the 20-year average P/E of 19.3. Currently, the S&P 500 is trading at 25 times earnings and 20.8 times 12-month forward earnings.
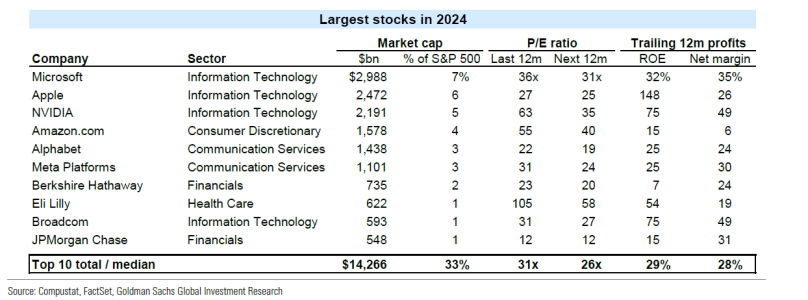
- Market Concentration – as noted earlier, stock market performance in 2023 was not broad based, with the “Magnificent Seven” reaping the majority of headlines and oversized returns. These are the same names that suffered large material losses in 2022. 2024 YTD, the top 20 names in the S&P Index make up, in the aggregate, 41% of the Index’s weight and 90% of the performance. This level of concentration is the highest we’ve seen in decades, bringing to mind the Nifty Fifty of the early 70’s and the internet bubble of the late 90’s.
The markets as we end the first quarter of 2024 are cautiously optimistic.
The strong equity market returns of 2023 have continued into 2024, with US equities outperforming foreign securities, and US growth companies outpacing US value in small-, mid- and large-capitalization sectors. Large cap value has shown signs of life during March, beating large cap growth near-term. It’s much too early to name this a developing trend, but broad portfolio diversification remains a stalwart risk-reducing tenet of ours.
The tech sector, 2023’s runaway winner, is the fourth best performing sector in the S&P 500 Index this year, trailing communication services, energy and financial services. While lagging in sector return ranking, it leads in proportional contribution, accounting for approximately 40% of the S&P 500’s YTD return while holding only a 30% weighting. While these top contributors (NVDA, MSFT, META, AMZN, LLY, BRK.B, JPM, XOM) remain a concentration risk concern, they are still growing revenues, on average, at a faster clip than the 10-year average of the S&P 500 Index.
Our allocations remain diversified by region, size and valuation, favoring quality above all else. Owning companies with fortress balance sheets, free cash flow generation, strong competitive advantages and sustainable earnings should do well as we move into a slower growth environment. We fully expect some market rotations into less-favored sectors like small- and mid-caps, International and value sometime in the future, as these appear “on sale’ relative to elevated tech levels.
Bonds were rangebound for the beginning of the quarter, holding relatively steady amidst the uncertain path of future Fed rate cuts. The 10-year Treasury yield rose and fell in January with a net increase of only 3 bps. The generally favorable economic data, highlighted above, demonstrated resilient economic growth and a baked-in market belief in upcoming Fed rate cuts. February saw yields continue to rise, deepening the yield curve inversion, often a pre-recessionary signal. Economic strength continued with January payrolls notably higher and the unemployment rate holding steady.
During the March FOMC meeting the Fed opted to leave interest rates untouched, again postponing the long-anticipated rate cut. However, the market maintains a very watchful gaze on any new and relevant economic data points, searching for more pronounced deflationary signals that give the Fed a greenlight to begin easing monetary policy (i.e. lowering short-term interest rates). When interviewed on the TV show “60 Minutes,” chair Powell noted that given the economic strength we have been witnessing, “we can approach the question of when to begin to reduce rates carefully”, in a sense implying that the Federal Reserve wanted more confidence that inflation is coming down in a sustainable way before committing to a rate cut schedule. However, this month’s economic data releases again point towards decelerating inflationary trends – a stronger than expected labor market and elevated manufacturing and wholesale prices. Given all the added color, the Federal Reserve must now walk a fine line – cutting to early may bring back inflation and necessitate further rate hikes, while delaying too long increases the chances of a mild-to-moderate recession.
So, which path will the Fed ultimately choose? Our Investment Committee believes that, based on the recent flow of economic data points which have signaled slowing deflation and, in some instances, pockets of upward pressure on prices, that a rate cut in the May FOMC meeting is unlikely. In our view, the Fed will remain steadfast and exercise patience until economic data begins to signal more sustainable and meaningful progress towards their inflation target of 2%. Our best estimate at this point would be that the first potential rate cut doesn’t happen until the summer, if even then, giving the Fed more time to contemplate their decision and better gauge inflation’s trajectory. We do believe that once the Fed decides to begin easing, there could be a potential steepening of the yield curve (short terms rates, more influenced by the Fed, will decline more than longer term rates). This is potentially good news for interest rate-sensitive sectors, such as banking, which have undergone some hardships given the challenging interest rate environment.
